
Data Averages are Not Valuable - They're Dangerous
- Gordon McCallum
- Feb 15, 2018
- 4 min read
Averages are used all the time in business. Average order value. Average cost per click. Average sales time. Average cost per acquisition. Average churn rate. They're all helpful metrics to know because they give you an simple dashboard view of business performance.
But are they really helpful? In actuality, they muddy the data so much that any decisions made from them are fundamentally flawed from the outset, and hidden gems are often missed.
As Google's analytics guru Avinash Kaushik is fond of saying, "all data in aggregate is crap." And he's totally right.
The Problem with Averages
Don't get me wrong - averages can be useful, but without data segmentation, you are left with a single number that does not reflect weights or distribution patterns contributing to them. Saying "he's a B student" is less accurate (and less actionable) than knowing that he gets all A's but one F. With that additional information, you know where to focus improvement efforts.
For example, we will use a commonly used average metric: average conversion rate, and a rate of 32%.
Now if I asked you if that rate is good, what would your answer be? You would clearly need more information, like what the "conversion" is measuring in this instance. But let's say you find it is in line with "the industry average" - don't get me started on that junk term - for your business. Can you make any marketing decisions or budget adjustment insights from that number? How would you know what to do it make it higher? Without more detail, that number is just noise.
But what if you then looked at the distribution of sales conversion rates, separated by segment:
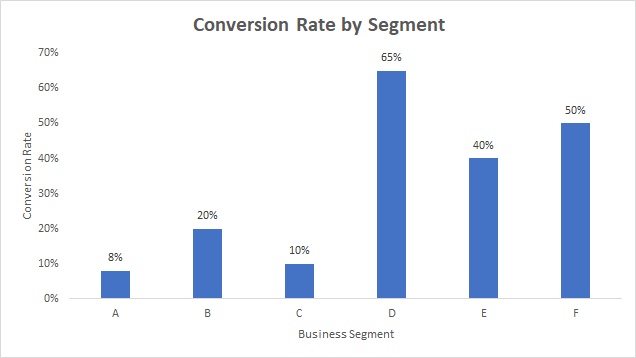
Now you see that you are actually converting some segments as low as 8%, and others as high as 65%. That's a variance of over 700%! So then ask WHY are you closing some segments as such a higher/lower rate than others. How do you determine that?
What if you break out the highest converting segment (D) by industry and see if there are any material differences?

Very interesting - industrial clients convert at 90% (wow) AND contribute the highest overall revenue within the segment. If you operate within a budget (and who doesn't), a useful takeaway might be to focus efforts on targeting prospects in the industrial sector for this particular business segment (since they're already working well), and figure out why publishing industry prospects are converting at less than half the rate, but still driving the second largest amount of revenue.
Perhaps you're getting a huge number of publishing leads but your competitive advantage is weaker to them. Or maybe your product is great for them, but the messaging doesn't connect well with their particular pain points. Regardless, the data provides a great view into a situation highly worth investigating.
In this example, a dollar spent in generating an industrial lead is more valuable than a dollar spent generating a nonprofit lead, so modify your lead scoring rules to rank industrial industry leads higher to surface the most viable prospects and/or accounts more quickly.
The Beauty of Segmentation
Segmentation can be iterated again and again, with virtually any data set, and the deeper you go, the more meaningful the data becomes. Instead of questions like "what can we do to improve our conversion rates," you can ask more direct questions like "should we focus on generating more industrial leads for segment D that convert at the highest rate, or to figure out why segments A, B, and C are underperforming so much and correct those deficiencies first?"
One of the amazing things about segmented reporting, too, is that the problems you're trying to solve get smaller and more manageable, and iterative improvements benefit from compounding. If you have a distant goal, it's far easier to reach it in multiple smaller achievements.
Making one big miracle improvement that raises conversion rates by 25% in one go (which if you can do without an insane time or resource investment, do that!) is great, but if you can make five more attainable changes that each improve conversion by 1/5 of that, you end up in an even better position, without needing to find and execute miracles to get there:

The results are clear. In the miracle approach, no added value was seen until after five weeks, whereas the iterative approach showed improvement after the first week, and then after each week (or iteration) after that. The net results?
Miracle approach: Total units were 525 after the starting point (100 each week, with 125 in week 5)
Iterative approach: Total units were 581 after the starting point (105, then 110, then 116, then 122, then 128)
That's a net gain of 56 additional units by making small improvements over time, rather than one big change that doesn't pay off until it's completed.
Using high level averages only would likely miss out on these additional gains by making it more difficult to uncover the deeper or more hidden areas for improvement.
The next time you're tasked with "improving revenue by X percent," break down the problem into component parts, and look at your data for where segmentation can work for you. It makes sense to figure out why it may be so effective for one segment, but not effective for others, and then either double down on your winning segments or improve your other segments to perform better. You will find more hidden gems in your data, exceed your goals more quickly and more often, and without having to find those elusive unicorn solutions to bring massive improvements in one fell swoop.
Recent Posts
See All
While not a new concept, the five whys are underutilized, given how little effort is required, and how impactful they can be.


Comments